Extreme Weather and Terrorism
Bradley Druzinsky and Connor Ford
Our initial analysis concerns two datasets. The first is a Global Terrorism Database which has information on over 170,000 terrorist attacks since 1970. Each unit in the database is an attack and includes information on the time, location, tactics, perpetrators, and targets of said attack. From the source of the dataset, a ‘terrorist attack’ is: “The threatened or actual use of illegal force and violence by a non-state actor to attain a political, economic, religious, or social goal through fear, coercion, or intimidation.” (SMART at University of Maryland)
The second data set is a Berkeley Earth dataset which contains average monthly temperature for a particular location, (i.e. city, state, or country), with data going back to 1750.
Some important features (variables) in the terrorism and temperature data sets
Terrorism Set
(https://www.kaggle.com/START-UMD/gtd/data)
- Event id
- Date
- Country
- City
- Latitude, Longitude
- Summary (of attack)
- Attack type (hostage, assassination, bombing, etc..)
- Weapon type
- Number killed
Temperature Set
(https://www.kaggle.com/berkeleyearth/climate-change-earth-surface-temperature-data/data)
- Date
- Average Temperature (of day)
- City
- Country
- Latitude, Longitude
Aggregating Master Data Set
After importing our datasets, the first task is to clean the data. This is a long, tedious process, that includes accounting for missing data, merging, and computing a master data frame for terrorist and temperature data in the United States. Below, we show a fraction of this work, with the chunk shown cleaning parts of the inital global terrorism dataset.
## Get and clean only US terrorist attacks
usaTerrorismData <- terrorismData %>%
  filter(country == 217)  %>%                               ## Filter for country == USA
  unite(date1, iyear,imonth,iday, sep="-") %>%              ## Unite seperate year, month, and day cols into one(y-m-d)
  mutate(dateLub = ymd(date1)) %>%                          ## Convert date into 'Lubridate' (YYYY-MM-DD)
  filter(!is.na(dateLub))  %>%                              ## Filter out obs with missing dates(failed to parse)
  mutate(city_char = str_to_lower(as.character(city))) %>%  ## Create new city column as character type
  mutate(month = month(as.POSIXlt(dateLub,
                                  format="%d/%m/%Y"))) %>%  ## Create a new month column
  mutate(year = year(as.POSIXlt(dateLub,
                                format="%d/%m/%Y"))) %>%    ## Create a new year column
  mutate(month_year = paste(month, year))                   ## Create new month, year column (M YYYY)
Here we will examine terrorist attacks by State since 1970:
We notice that New York skews the data so we will examine the data without New York:
And now we will examine attacks as time progresses from 1970 to present day: (You can also view this Shiny application hosted at: https://fordc5.shinyapps.io/interactiveterrorism/)
We will now use the latitude and longitude of each observation in order to group each of our observations into regions. We will utilize k-means clustering in order to do so. After cross-validation, we found that k = 20 produces the best clustering for our data. We are interested in creating regions instead of states because there is no comprhensive library that converts latitude and logitudes or cities to states. Furthermore, this clustering is easily extended to regions across the globe making adding other data from around the world easier.
cluster <- function(latVector, longVector) {

  set.seed(4747)                                        ## Set seed for reproducibility

  lat_name <- "realLat"                                 ## Name realLat column
  long_name <- "realLong"                               ## Name realLong column
  latlong <- data.frame(latVector, longVector)          ## Initialize new data frame with lat and long params
  names(latlong) <- c(lat_name, long_name)              ## Apply names to frame

  latlongCluster <- kmeans(latlong,
                           centers = 20,
                           nstart = 10)                 ## Run k-means clustering with centers & nstart

  group_lat <- "GroupLat"                               ## Name GroupLat column
  group_long <- "GroupLong"                             ## Name GroupLong column
  latlongCenterData<-data.frame(latlongCluster$centers) ## Initialize data frame with centers
  names(latlongCenterData)<-c(group_lat, group_long)    ## Apply names to frame

  latlongCenterData$clusterCenter <-
    apply(latlongCenterData,1,paste,collapse=",")       ## Combine latlongCenterData columns

  group_name <- "GroupNumber"                           ## Name GroupNumber column
  resultData <- data.frame(latlongCluster$cluster)      ## Initialize data frame with kmeans clusters
  names(resultData) <- c(group_name)                    ## Apply names to frame

  resultData <- resultData %>%
    mutate(LatLongCenter =
        latlongCenterData$clusterCenter[GroupNumber])   ## Get appropriate centroid location for each reg #

  resultData$cluster <-
    apply(resultData, 1, paste, collapse = ",")         ## Create a new col `cluster` columns collapsed together

  return(resultData$cluster)                            ## Return the comma seperated cluster data as vector
}
We want to create a model to forecast future terrorist attacks with a neural network. First, we must clean our master data - this includes filtering out insignificant or unnecessary variables (both categorical and some numerical). We must also check to make sure our data frame contains no missing (na) values.
Because our neural net takes so long to train, initial CV iss limited to experimenting with just a handful of different hidden layers (c(3), c(3,5), and c(5)). The code for this model is below:
# Neural net model
set.seed(4747)                                                          ## Set seed for neural net

max = apply(nnData, 2, max)                                             ## Get max of data
min = apply(nnData, 2, min)                                             ## Get min of data
scaledData = as.data.frame(scale(nnData, center=min, scale=max-min))    ## scale data from min to max

sampleSize = 0.67 * nrow(scaledData)                                    ## Sample from 2/3 of the observations
index = sample(seq_len(nrow(scaledData)), size=sampleSize)              ## Compute index sample

trainNNData <- scaledData[index,]                                       ## Get training set
testNNData <- scaledData[-index,]                                       ## Get test set

neuralNet <-neuralnet(isAttack~month.x+Region+TempDifference+
                      AttacksPrevYearInReg+nKilledPrevYearInReg,
                      trainNNData, hidden=3, linear.output=TRUE)        ## Fit neural network on data
We can assess this model by looking at a sample of predictions as well as variable importance.
Visualization of neural network with a hidden layer of 3: 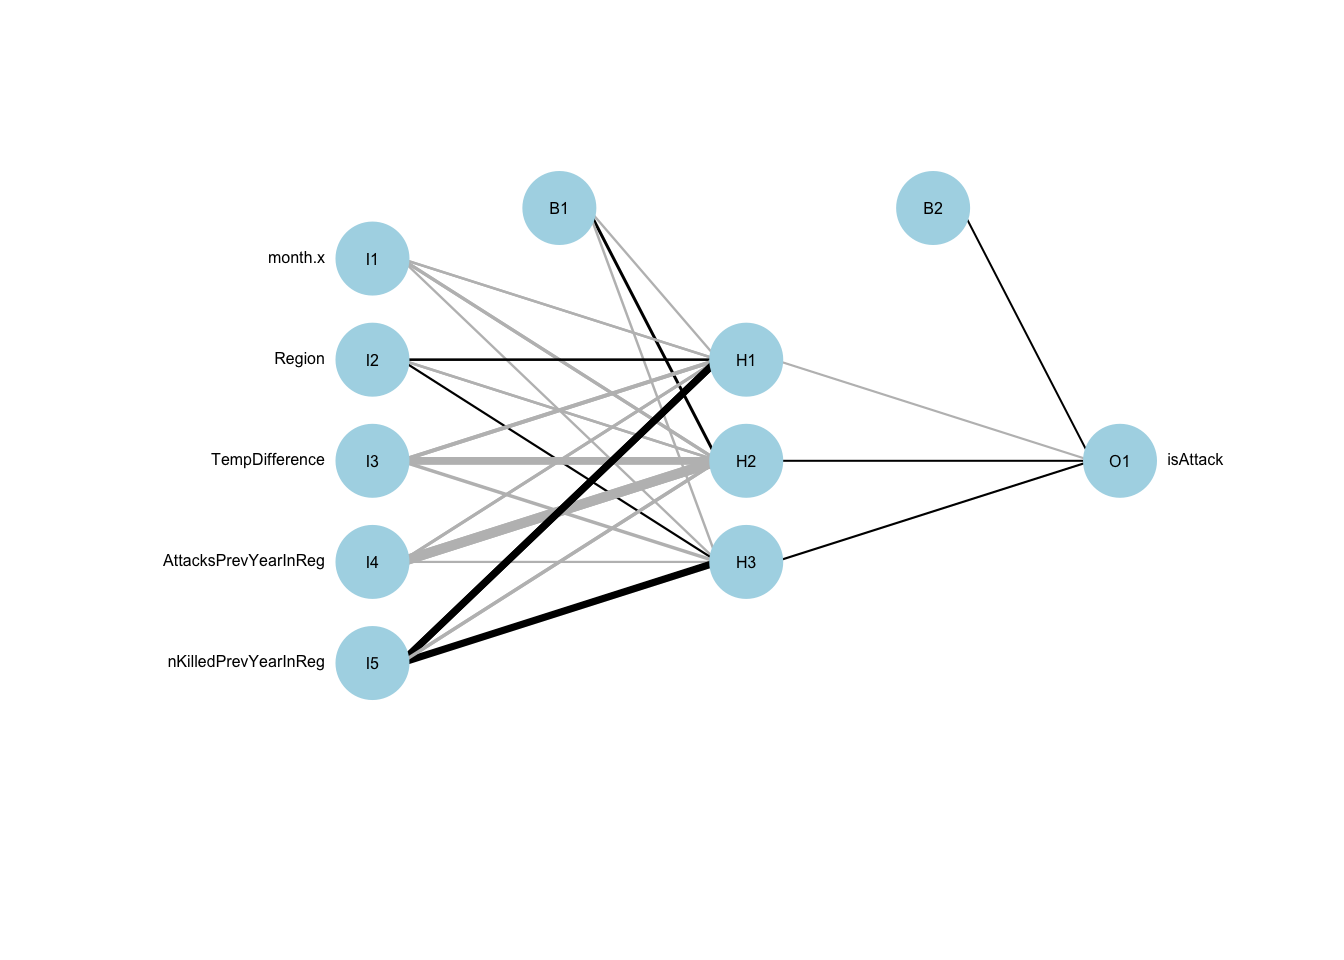
##   actual     prediction
## 1      0 0.005254503598
## 3      0 0.010555180528
## 5      0 0.004713353460
## 6      0 0.004963625267
## 7      0 0.003498189848
## 9      0 0.004982823047
## # A tibble: 2 x 2
## actual `mean(prediction)`
## <dbl> <dbl>
## 1 0 0.008275441667
## 2 1 0.017669455448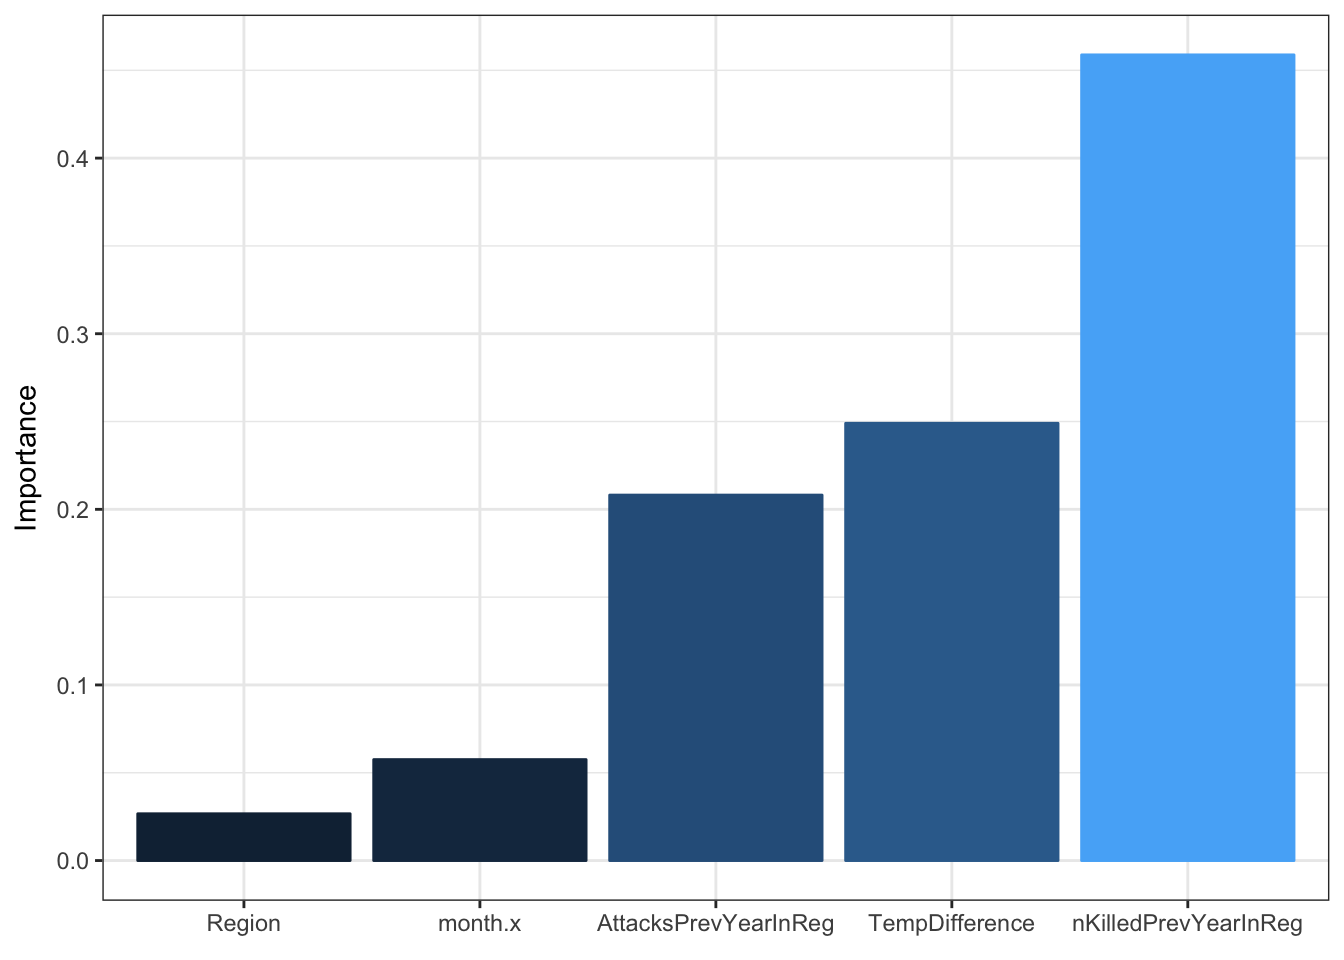
That did alright. The predictions appear to be larger for test observations with an attack occuring. However the prediction values are very small - and this makes sense because a terrorist attack in a given month is unlikely - and temperature difference has little effect. But now let’s try to predict whether a terrorist attack is going to happen in a given year, rather than a given month in a region. This is going to require a bit of data re-wrangling to get the appropriate explanatory variables. We then use the same neural net code as above to initialze our model.
Results for neural net by year:

##    actual   prediction
## 4       0 0.1634625156
## 5       0 0.1635298512
## 6       1 0.1634625156
## 9       0 0.1634725187
## 11      1 0.1634722189
## 12      1 0.2303895829
## # A tibble: 2 x 2
## actual `mean(prediction)`
## <dbl> <dbl>
## 1 0 0.3649511678
## 2 1 0.4981493106
#### So was John Kerry right?
It’s hard to tell. But we do know a couple things.
- Predicting when a terrorist attack is going to occur is difficult. However, it appears feasible to observe when regions are more suseptible to terrorist activity than others.
- Temperature difference has little to no effect on our model. There are a few possible explanations for this. The first is that there is no actual impact. The second is that we need more explanatory variables drawing on drought, and natural disaster data sets. The third is that we are looking at the wrong place in the world. Perhaps if we looked at countries in the middle east, with higher terrorist attack rates and more susceptible to extreme weather (droughts in Syria’s case) then significance might exist. And fourth, the visible effects of climate change may not be strong/frequent enough to see an impact on terrorism. We tend to lean towards the fourth explanation.
- We would love to run our model on a data set with additional explantory variables in wind, rainfall, and a natural disaster (earthquake) index as well as terrorism and climate observations from around the world.
Please visit our GitHub repository for source code and much more detail (and code!) for this analysis: https://github.com/ST47S-CompStats-Fall2017/ma154-project13-teamclimate